Factory Dashboards
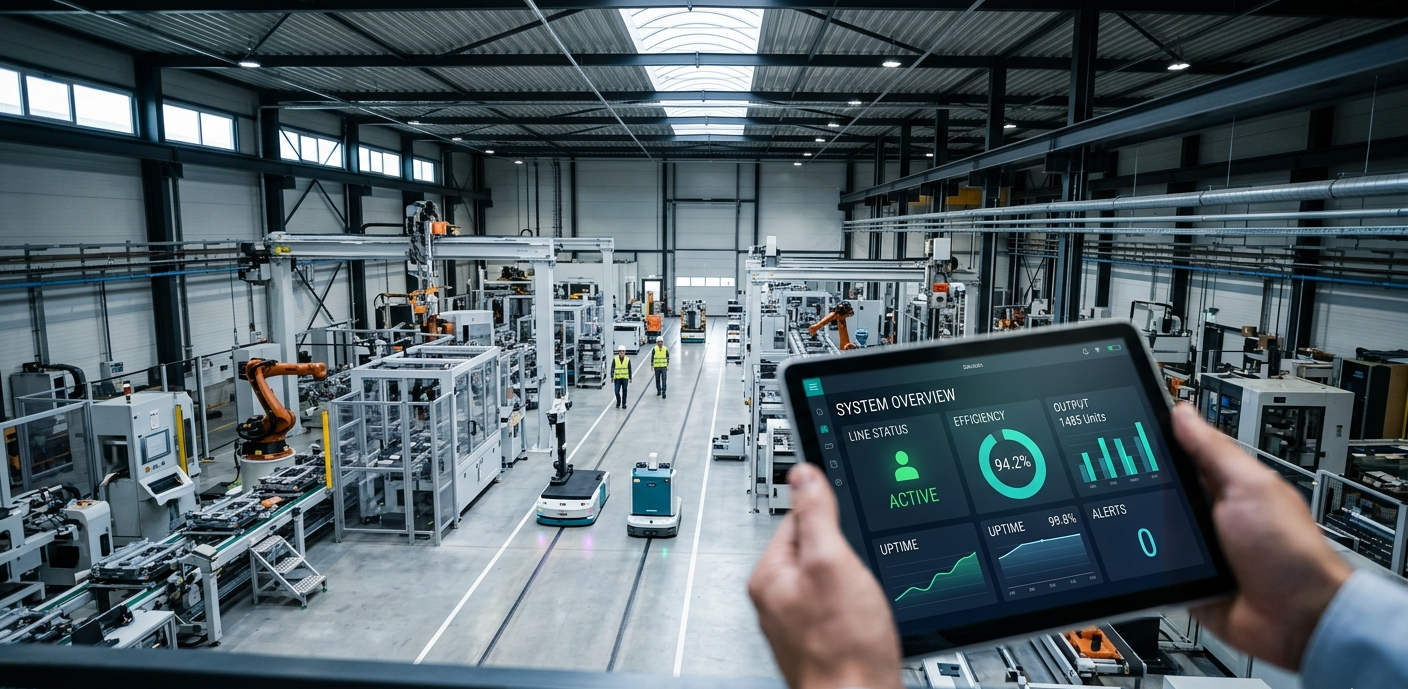
Production, quality, downtime, and maintenance signals organized for daily decision cycles.

Industrial Intelligence for Manufacturing and Spatial Data
Transforming complex factory operations and geospatial information into intelligent, decision-ready insights for modern industries.
Dashboard
Convert production signals, downtime patterns, and site performance data into a clear interface for daily action.
Production, quality, downtime, and maintenance signals organized for daily decision cycles.
Thresholds, trend changes, and exception patterns surfaced before they become reporting delays.
Purpose-built workflows that match each plant, site, asset network, or management rhythm.
Digital Twin
Build a practical industrial twin that tracks what is running, where it is happening, and what requires management attention.

Spatial Intelligence
Combine location, infrastructure, asset, and performance data into map layers that support planning, monitoring, and investment decisions.
Solutions
Manufacturing SaaS
GIS Services
AI-Assisted Analytics
Digital Twin
Implementation
A structured delivery approach that turns raw operational, spatial, and asset data into decision systems your teams can use in daily management.
Map the operating question, stakeholder needs, current reporting gaps, and decisions the platform must support.
Connect production, quality, maintenance, spatial, and business datasets into a reliable analytics foundation.
Structure the metrics, asset relationships, alerts, and analytical logic behind the decision workflow.
Release dashboards, review views, and operational routines that teams can use in daily management.
Evidence
Implementation evidence is measured through practical operating improvements: faster reporting cycles, unified decision layers, and clearer review workflows for industrial teams.
Reduced manual reporting and improved shift-level performance review.
0faster reporting cycleCombined spatial, asset, and operating data into map-based planning views.
0decision layers unifiedStart With Visibility
Start with a focused consultation to define the operational questions, data sources, and decision workflows that matter most to your team.
Discovery call, data review, and dashboard roadmap.